Aerial view of Edmonton city skyline with North Saskatchewan

Edmonton
Market Data

A technical analysis of the Edmonton Metropolitan Region real estate sector, focusing on historical price evolution, inventory cycles, and affordability metrics for first-time buyers utilizing the FHSA framework.

Average Price Indices (HPI)

Single Family Detached

The benchmark price for detached homes remains the primary driver of the Edmonton market. Current data indicates a steady absorption rate in suburban communities.

$485,000 - $520,000*

*Estimated 2024 Benchmark

Semi-Detached / Duplex

A high-growth segment for first-time buyers. These properties offer a balance between square footage and affordability, ideal for tax-efficient FHSA withdrawals.

$380,000 - $415,000*

*Estimated 2024 Benchmark

Apartment Condominiums

The most accessible entry point. High inventory levels in the downtown core continue to provide buyers with significant negotiation leverage.

$185,000 - $230,000*

*Estimated 2024 Benchmark

Capital Requirements

Calculating the necessary downpayment is a critical step in the home-buying evolution. In Canada, properties under $500,000 require a minimum 5% downpayment. For a typical Edmonton starter home priced at $400,000, the minimum capital requirement is $20,000.

The FHSA Advantage:

By maximizing the $8,000 annual contribution limit, a couple can accumulate the required $20,000 downpayment in approximately 15 months, leveraging tax refunds to further accelerate the timeline.

  • Closing Costs: Budget 1.5% to 4% of the purchase price for legal fees and inspections.
  • Mortgage Insurance: Required for downpayments under 20% (CMHC/Sagen premiums).
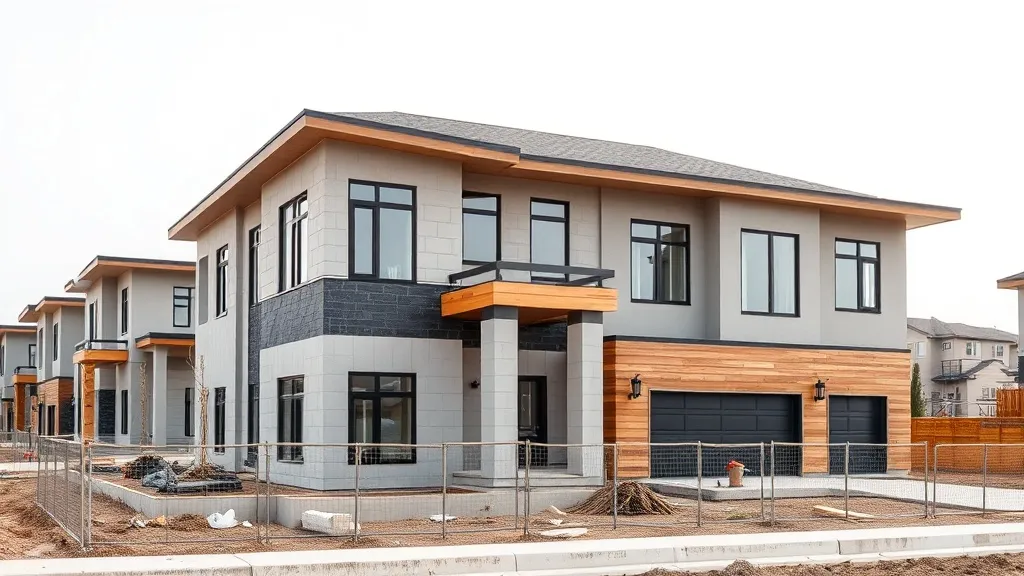
Modern residential construction site in Edmonton, suburban d
Figure 1.0 — Suburban Development Expansion in Southwest Edmonton

Regional Affordability Metrics

Comparative analysis of price-to-rent ratios and household income requirements across the Edmonton Metropolitan Region.

Central / Downtown

18.4x

Price-to-Rent Ratio

Southwest (Windermere)

24.1x

Price-to-Rent Ratio

West (Lewis Estates)

21.5x

Price-to-Rent Ratio

North (Griesbach)

20.8x

Price-to-Rent Ratio

Note: A ratio below 15 indicates it is significantly cheaper to buy than rent, while a ratio above 20 suggests renting may be more economically viable in the short term. Edmonton's average currently sits at 21.2, reflecting a balanced market that favors long-term equity growth through vehicles like the FHSA investment portfolio.

Inventory Supply & Absorption

Inventory levels in Edmonton are subject to seasonal fluctuations, with peak supply typically occurring between April and June. The "Months of Supply" metric—which measures how long it would take to sell all current listings at the current sales pace—is a primary indicator of market temperature.

Currently, the market is experiencing a transition toward a "Balanced" state, with approximately 3.5 to 4.2 months of inventory. This environment provides first-time buyers with sufficient choice without the extreme competition found in "Seller's Markets" (under 3 months of supply). Understanding these cycles is vital for timing the account closure and purchase execution.

4.1 Avg. Months Supply
48 Avg. Days on Market
97% Sale-to-List Ratio
+12% New Listings (YoY)

This platform is designed for educational and informational purposes only. The economic data provided is sourced from public records and market reports but is subject to change without notice.

The materials presented here are reference-only and do not constitute professional financial, legal, or real estate advice. Users should consult with certified professionals before making investment decisions.

Past performance of the Edmonton real estate market is not indicative of future results. All calculations regarding FHSA benefits are theoretical and depend on individual tax situations.

Ready to Analyze Your Options?

Access our comprehensive guide on FHSA contribution limits and maximize your savings potential in the Edmonton market.